SOLUTION 01

Cultural Heritage & Conservation

Map pigments, distinguish original materials and overpaints, and monitor degradation without physical sampling.

The decision this system supports.

Outcome: See subtle variations while preserving their exact position on the object.

Evidence: Pigment maps, calibrated colour, reflectance curves and spatially resolved condition documentation.

Illustrative range: 300–1000 nm

Questions to answer

– Which pigments and materials differ?

– Where are overpaints or previous interventions?

– How is the surface changing over time?

APPLICATION EVIDENCE

See the material differently.

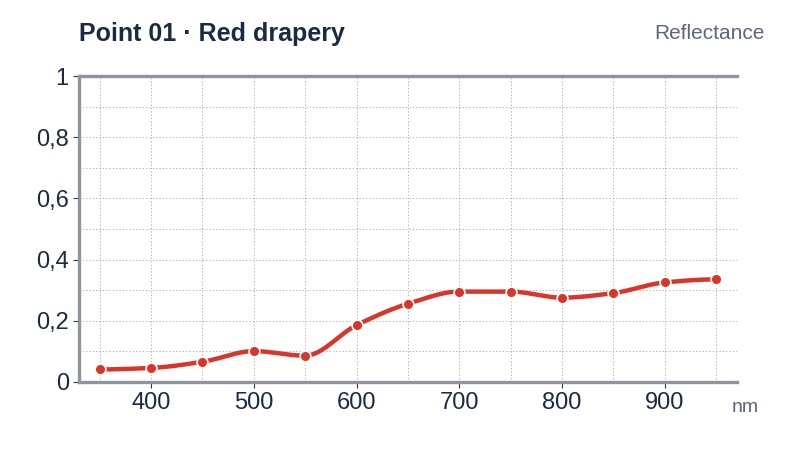
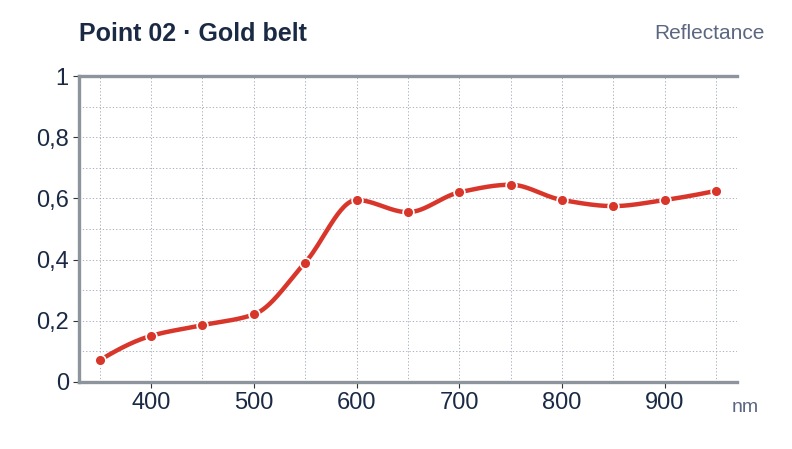
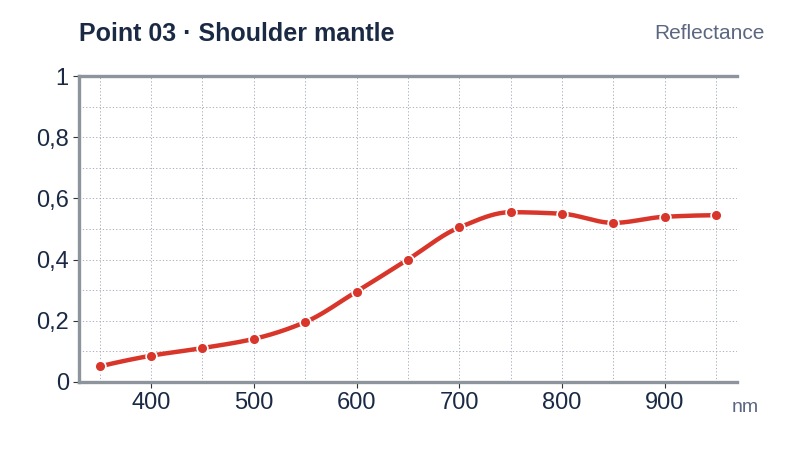
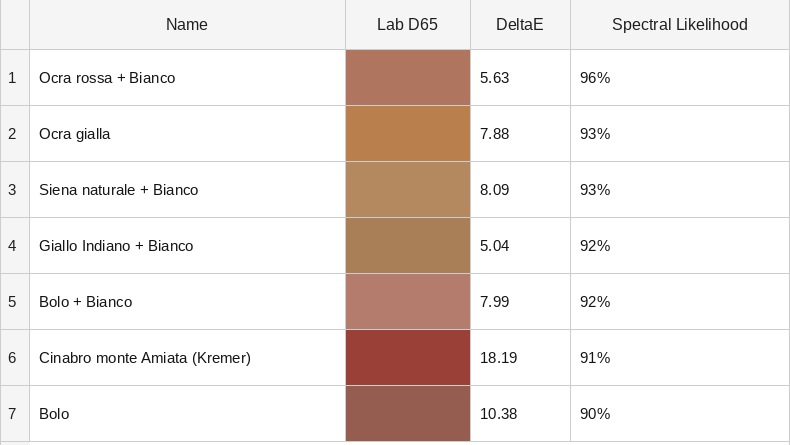
Reflectance
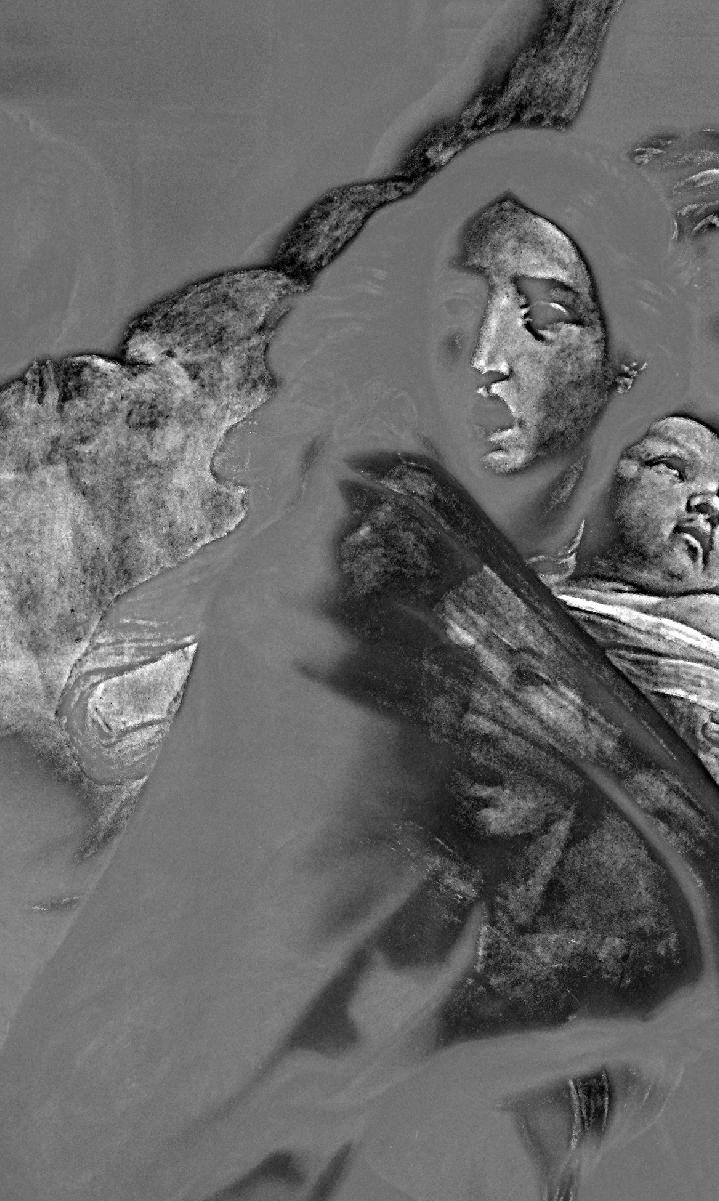
Transparency
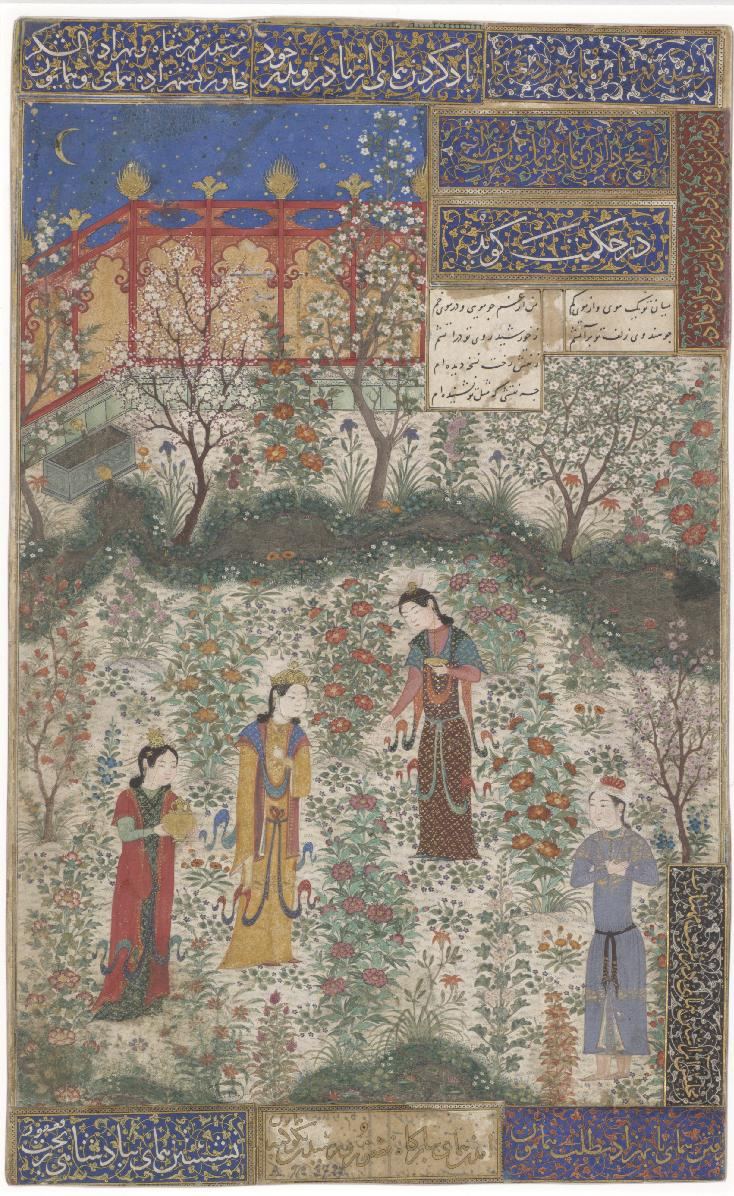
Hidden stamp

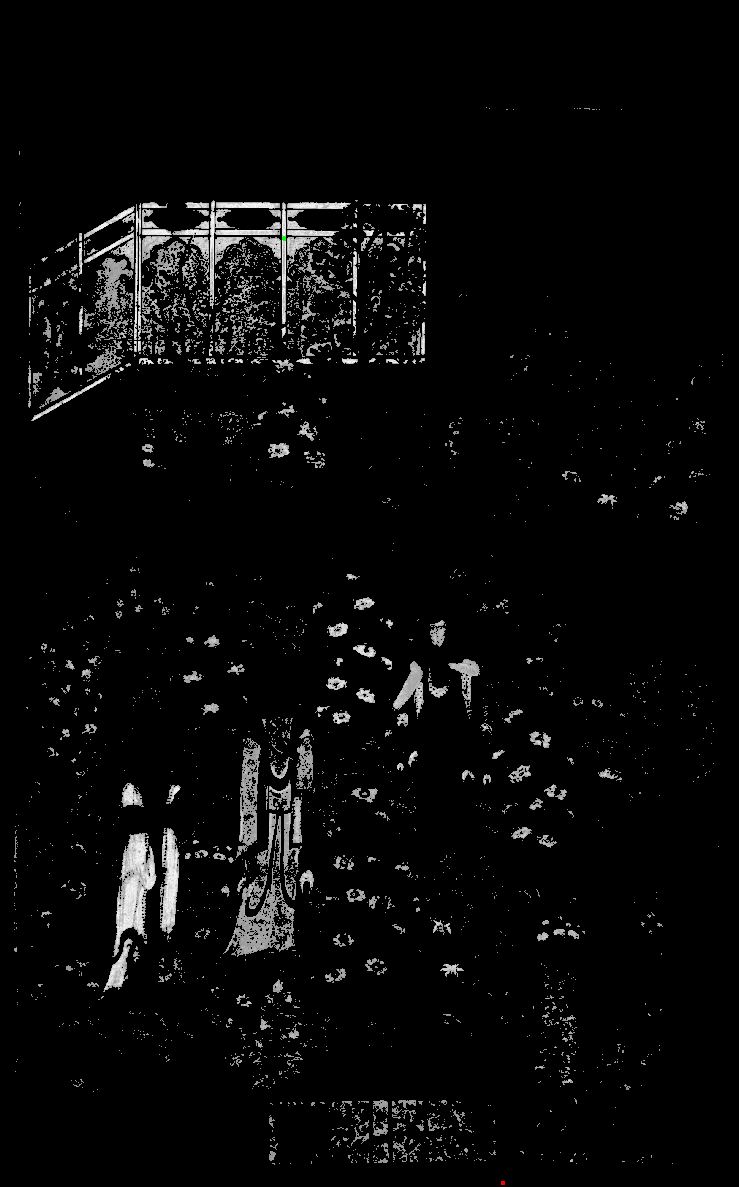
Profilocolore system test at The Manuscript Institution of Türkiye, İstanbul

Click an image to open the full-size view. The media and captions remain editable in Elementor.

Capabilities

01

Spectral and multispectral capture

Configured around the application and its required evidence.

02

Colorimetric documentation

Configured around the application and its required evidence.

03

Registration and comparative analysis

Configured around the application and its required evidence.

A controlled path from question to evidence.

01

Define

Clarify the object, conservation question and required evidence.

02

Acquire & calibrate

Capture calibrated image data under controlled conditions.

03

Correlate & map

Connect spectral and colour differences to their spatial context.

RESEARCH & PROFESSIONAL NETWORK

Connected to European research and the conservation supply chain.

Profilocolore is an SME beneficiary of the UNVEIL Marie Skłodowska-Curie Actions Doctoral Network and an Assorestauro associate member in analysis, survey and diagnostics.

APPLICATION 01 · CULTURAL HERITAGE & CONSERVATION

Pigment & Condition Mapping

Where do materials differ—and what has changed?

Application

Combine spatial and spectral evidence to map pigments, possible overpaints, previous interventions and degradation patterns without taking physical samples.

Operational value: Focus specialist attention, strengthen documentation and support more informed conservation decisions.

Outputs

  • Material and pigment distribution maps
  • Spectral curves linked to image positions
  • Condition and difference layers
  • Calibrated colour documentation

Technology path

01

SpectraPick

Connects measurements, spectra and processed layers to their exact image positions.

02

PickViewer

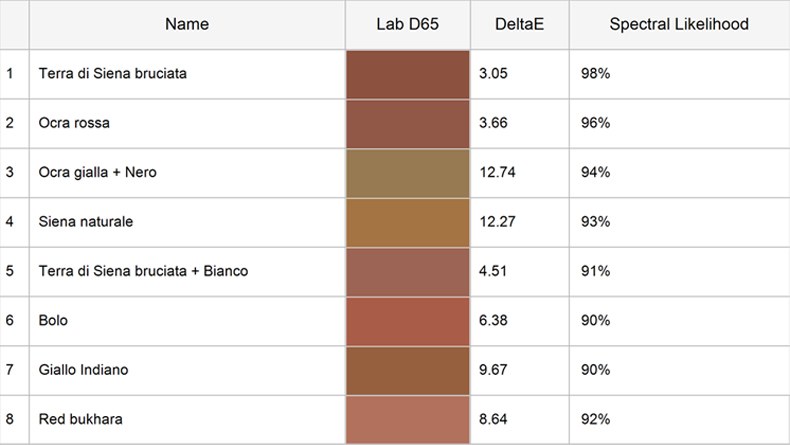
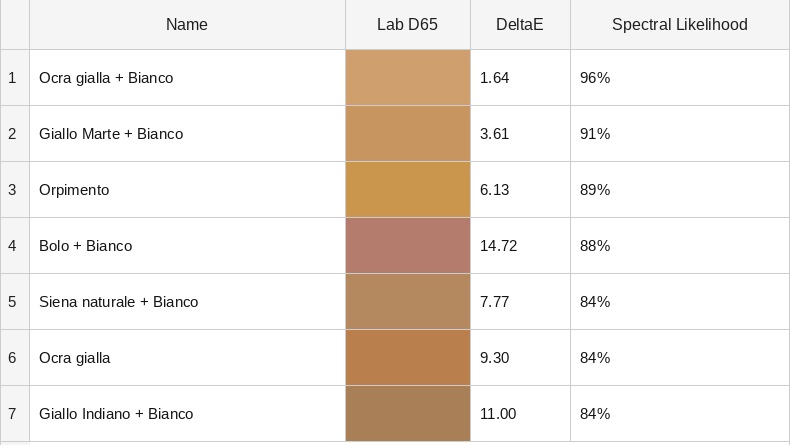
Supports comparison of measured reflectance with reference spectral data.

03

Spectral DataBase

Measures, maps and reports change between calibrated acquisitions.

04

DeltaPick / DeltaViewer

Aligns and corrects multispectral images and performs colour and spectral calibration.

CASE STUDY 01 · CULTURAL HERITAGE & CONSERVATION

Mapping material differences across a painted surface

A non-invasive HMI application designed to separate spectral behaviours, connect them to precise image locations and support conservation interpretation.

The question

Where do materials, interventions or condition patterns differ—even when the visible image appears continuous?

01

Subject

Paintings, frescoes and decorated surfaces

02

Objective

Material and condition differentiation

03

Output

Spatial spectral maps and selected-point curves

Challenge

Conservators need to understand how a surface varies without removing samples from every area of interest. Conventional photography documents appearance, but visually similar regions may respond differently across the spectrum.

Method

01

Define regions of interest

Identify the conservation question, representative areas and acquisition scale before configuring the system.

02

Acquire calibrated bands

Capture registered image bands under controlled illumination with spectral and radiometric references.

03

Compare pixel responses

Inspect spectra at selected points and group areas with similar or contrasting reflectance behaviour.

04

Return spatial evidence

Deliver interpretable maps and curves while preserving the exact location of each measurement.

Evidence returned

  • Registered spectral image cube
  • Reflectance curves from selected points
  • Material-difference or condition maps
  • Repeatable acquisition record

Operational value

The result is not a material identification claim in isolation. It is a calibrated evidence layer that helps specialists target interpretation, comparison and any subsequent analytical work.

Technology

  • HMI acquisition system
  • Calibrated illumination
  • Spectral analysis software
  • Colour and radiometric references

Measurement confidence

Scientific measurements, not only diagnostic images.

Calibrated acquisition and processing deliver approximately 98% accuracy and repeatability, turning each image into comparable colorimetric and spectral evidence.

Pixel by pixel

Measured evidence

CIELAB coordinates and reflectance spectra sampled in at least 13 bands remain tied to their exact position on the object.

Traceable

Controlled references

Absolute radiometric and colorimetric references connect field acquisition to laboratory measurement and international metrology standards.

In situ

Non-invasive operation

Portable, battery-capable configurations support acquisition on site without contact with the surface.

START A CONVERSATION

What do you need to reveal, measure or compare?